PRELIMINARY PERFORMANCE REVIEW OF THE
PUBLIC EMPLOYEES INSURANCE AGENCY FINANCE BOARD
The Board has not Provided
Financial Stability to the
Public Employees Insurance Agency
Issue Area 1: The Board has not Provided Fiscal Stability to the Public Employees Insurance Agency.
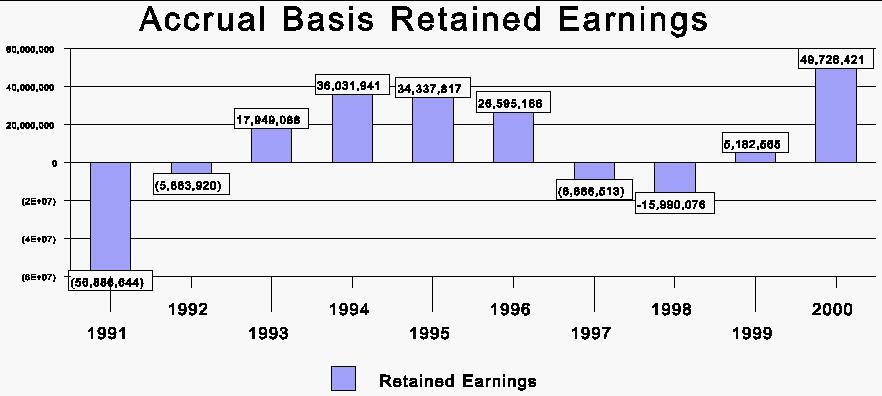
The Public Employees Insurance Agency (PEIA) Finance Board was established in 1990 during a time in which PEIA experienced a significant financial loss. The Board was created to eliminate the deficit and develop financial plans providing financial stability for the agency. Although the Board should be commended for eliminating the deficit of 1990, the Board has not been successful in preventing a similar situation from occurring in 1997 and 1998 (see Figure 1). According to WV Code §5-16-5 the Finance Board:
...is to bring fiscal stability to the public employees insurance agency through development of annual financial plans and long-range plans designed to meet the agency's estimated total financial requirements, taking into account all revenues projected to be made available to the agency...
Figure 1 shows that in 1997 and 1998, the agency's financial condition returned to a similar state that the Board was created to avoid, however not nearly to the same magnitude. Although the Board eliminated the deficits of the early 1990's and accumulated surpluses, those surpluses were eventually exhausted causing deficits to recur. This recurrence does not fit the definition of financial stability. The Board was created to return the agency to solvency, and to avoid a similar situation in the future. In this regard, the Board was not successful.
Causes for Financial Instability
There are five primary causes for the instability that has occurred. These are as follows:
1) The Board has not developed consistent balanced financial plans in which current expenses will be paid for by current revenues. Consequently, the Board relies on existing surpluses to balance the financial plans.
2) The Board's financial planning lacks objectives that promote financial stability.
3) The Board is reluctant to raise premiums on employees and particularly retirees.
4) Retiree costs are growing at a faster rate than the State's contributions. This has put pressure on the Legislature to increase funding, or require PEIA to reduce the subsidization of retirees.
5) Employees' and retirees' utilization rates of PEIA's
insurance may be high compared to other insurance plans. Not until 1998
did the Board begin to address utilization through increasing out-of-pocket
expenses, deductibles, and co-payments. However, addressing utilization
became necessary because the Board was faced with a financial deficit.
Given that employees and retirees are charged a relatively low percentage
of the costs, it stands to reason that this encourages a high utilization
rate of various medical services.
Cause #1: The Board Implements Deficit Financial Plans for Current Operations.
The Board has not developed a balanced financial plan for current
operations in six of the last seven years (FY 1994 - FY 2000). Table
1 shows that plans for 1994, 1995, 1996 and 1998
expected
claim expenses to exceed expected premium revenues. When
other expenses are included, Table 1 shows that the result has been forecasted
deficits for current operations in six of the last seven years.
These
imbalanced financial plans for current operations were approved and implemented
by the Board. In order to balance the expected deficits for current
operations, the Board relied on existing surpluses accumulated in previous
years. Consequently, the Board has whittled away existing surpluses each
year from 1994 through 1999 in amounts between $5 million and $36 million
(see Table 1). As Figure 1 illustrates, by 1997 and 1998, the surplus was
eliminated.
| Table 1
Projected Premiums, Claim Expenses, and Retained Earnings for Current Year Operations |
|||
|
Period |
Premiums
Revenues |
Claims
Expenses |
Retained Earnings
Surplus/(Deficit) |
| 1994 | $270 million | $271 million | -$22.5 million |
| 1995 | $274 million | $289 million | -$36.4 million |
| 1996 | $278 million | $286 million | -$30.5 million |
| 1997 | $304 million | $301 million | -$18.6 million |
| 1998 | $315 million | $324 million | -$30.1 million |
| 1999 | $358 million | $342 million | -$5.5 million |
| 2000 | $374 million | $350 million | $2.7 million |
The Board was aware in 1995 that the surplus was dwindling and use of
the surplus to balance financial plans would be exhausted at some point.
In March 1995, the Board considered appropriate actions that could be taken.
One idea the Board considered is the following:
...adopting a policy which would allow the actuaries, in doing their financial forecast, to base their forecast on a percentage of the surplus subsidy offsetting financial needs on a fiscal year basis, rather than using all the surplus in a couple of years and implementing major cost adjustments. In theory, the Finance Board would instruct the actuaries, to apply, say, 15% of the surplus towards offsetting projected cost increases. Premiums could be set based on the lower projected utilization. This approach would give us a two to three year time-frame in which to deal with incremental increases, if they are necessary, rather than a severe magnitude increase like what occurred in 1989 and 1990. [PEIA Finance Board Meeting, March 29, 1995, page 4.]
Essentially, the Board was considering using only a portion of the
surplus and raising costs gradually over several years to avoid exhausting
the surplus and being forced to raise costs substantially over a shorter
period of time. It is apparent that the Board did not implement this idea.
It continued to use all of the surplus to offset the deficits in current
financial plans. By FY 1997 the Board was faced with raising additional
funds. The Board requested $7.1 million from the Legislature in FY 1998
to avoid raising deductibles for employees and retirees to offset the deficits.
This amount was split between FY 1998 and FY 1999 in order to balance the
PEIA's budget in FY 2000. The Board's financial plan for FY 2000 was the
first, in the last seven years, in which it forecasted balanced current
operations. This may have been because the Board did not have an existing
surplus to draw upon. Therefore there was a need to plan to balance current
operations.
Cause #2: The Board Lacks Plan Objectives that Would
Promote Financial Stability.
A review of Board minutes suggests that even though there is often discussion concerning long-range plans, the Board has not planned very far beyond the forecasted year. The Board was not required to provide long-range plans which would include projections for future fiscal year costs until 1999 (WVC §5-16-5). The financial plans were calculated on a year to year basis before the 1999 legislation. The Board members appear to be ambivalent to reducing existing surpluses and producing a balanced financially solvent plan. Over the years, surpluses have been reduced by as much as $36 million. Examples of the reluctance to use the surplus but the hesitancy to do anything about the financial instability can be seen in 1992 -1997 Board minutes which include the following:
"The Finance Board recognizes that PEIA is facing significant financial
instability possibly for this year and certainly for the coming years."
(January 16, 1992)
"...the Finance Board needs to consider, on some basic level, where
the Board is in terms of spending the surplus." (April 17, 1992)
"...the 1994 plan is not within itself a balanced plan and that it
is a deficit spending plan which is only made possible by using the surplus."
(January 25, 1993)
"...even though the plan is reporting a surplus it is actually depleting
the existing surplus that has been formed over time." (October 13,
1994)
Finally, when the surplus had been exhausted the Board members discussed
that "...We have used a state surplus to subsidize these years of
operation and now we're passing it on to the state taxpayers or on the
employees." The members also indicated that they did not "....feel
there was enough long term planning." (Oct 29, 1997). This gradual
progression of concern for the stability of the plan and yet the reluctance
of the members to actively produce a balanced plan caused the elimination
of the surplus. A surplus is an important cushion to provide stability
against unexpected events, and forecasting errors.
The Board needs to establish written objectives that will guide the
planning process and promote financial stability, such as:
Another reason the surplus was eliminated is that the Board is reluctant
to raise premiums on employees and retirees. As indicated previously, the
Board considered not using the entire surplus which would have involved
making changes to premiums or benefits to avoid severe cost increases when
the surplus was eroded. Significant cost increases to employees and retirees
were implemented in 1991. However, the Finance Board did not raise premiums
again for employees and retirees until 1997 when the financial circumstance
which presented itself was similar to the 1990 situation. Out-of-Pocket
maximums stayed static for employees until the 2000 plan year. Deductibles
were implemented in 1991 and remained the same until the 2000 plan year.
| Table 2
Premium Changes |
|||
| Period | Single Employee | Employee Family | Single Retiree |
| 7/1990 | 10% | 10% | 0% |
| 11/1990 | 0% | 0% | 0% |
| 1/1991 | -100% | 65% | 83% |
| 7/1991 | 0% | 0% | 0% |
| 1992 | 0% | 0% | 0% |
| 1993 | 0% | 0% | 0% |
| 1994 | 0% | 0% | 0% |
| 1995 | 0% | 0% | 0% |
| 1996 | 0% | 0% | 0% |
| 1/1997 | n/a | 25% | 13% |
| 7/1997 | 0% | 0% | 0% |
| 1998 | 0% | -4% | 0.4% |
| 1/1999 | 0% | 0% | 0% |
| 7/1999 | 0% | 0% | 0% |
The Board minutes show an aversion to raising premiums on employees and retirees. According to meeting minutes the following standards were passed by the Finance Board:
"...the Board eliminate(s) the retiree increase. ...eliminate(s) the drug co-payment increase." (March 25, 1992)
"...graduated contribution increases of $10 (ten dollars) based on salary effective January 1, 1997, with the proviso that any increase in revenue beyond the expected $7.0 million from the State be returned to employees by decreasing employee contributions..." (October 26, 1995)
"...stated that they would not consider changes or increase in retiree premiums or the subsidization." (December 18, 1996)
"...last year we needed $50 million and $40 million came directly
from the employer and nothing came from the employee." (November 13,
1998)
The Board went years without increasing premiums, co-pays, out-of-pocket
maximums and deductibles from 1991-1996. It has been forced to raise many
costs, especially within the 2000 and 2001 healthcare plans, in order to
restore fiscal stability and cut costs for PEIA. The following provides
an example of some of the recent changes in medical expenses and prescription
drug costs implemented by the Finance Board:
| Table 3
Medical Care Inflation & Medical Care Sub-components |
||||
| Year | Medical
Care |
Physicians' Services | Prescription Drugs | Hospital
Services |
| 1990 | 9.0% | 7.1% | 10.0% | 10.9% |
| 1991 | 8.7% | 6.0% | 9.9% | 10.2% |
| 1992 | 7.4% | 6.3% | 7.5% | 9.1% |
| 1993 | 5.9% | 5.6% | 3.9% | 8.4% |
| 1994 | 4.8% | 4.4% | 3.4% | 5.9% |
| 1995 | 4.5% | 4.5% | 1.9% | 5.0% |
| 1996 | 3.5% | 3.6% | 3.4% | 4.5% |
| 1997 | 2.8% | 3.0% | 2.6% | 3.3% |
| 1998 | 3.2% | 3.0% | 3.7% | 3.3% |
| 1999 | 3.5% | 2.8% | 5.7% | 4.2% |
| 2000 | 4.1% | 3.7% | 4.4% | 5.9% |
| Average | 5.2% | 4.5% | 5.1% | 6.4% |
| Source: Bureau of Labor Statistics, Consumer Price Index | ||||
Cause #4: Employer Contributions to Cover Retiree Costs
In 1992, the Legislature gave the Finance Board the option to use a portion of employer contributions to cover part of the costs to insure retirees. This is indicated in WVC §5-16-5:
In addition, the finance board may allocate a portion of the premium costs charged to participating employers to subsidize the cost of coverage for participating retired employees, on such terms as the finance board determines are equitable and financially responsible.
The Board exercised this authority soon after the legislation passed. Although the Board did not have statutory authority to subsidize retiree costs until 1992, the Board was in fact subsidizing retirees prior to 1992. This is indicated in the 1992 minutes:
The Finance Board has allowed for a State subsidy for retirees over the last few years and in the 1993 plan, even though it is not allowed in legislation. (January 16, 1992)
Table 4 illustrates how a portion of employers' contributions are used
to cover retirees' costs. The first column shows that retirees' expenses
exceeded their premium payments by $55.8 million for FY 2000. State and
Local employers were charged an amount that exceeded what was needed to
provide coverage for State and Local employees. The excess of $91.2 million
from the State and $7.9 million from Local employers was used to cover
the retiree imbalance. What remained after the allocation to cover retiree
costs was surplus revenue.
|
Incurred Financial Report FY 2000 |
|||||
| Retirees | Millions | State Employees | Millions | Local Employees | Millions |
|
Retiree Premium Payments |
$32.1 |
Employer Contributions
Employee Premium Payments
Total |
$286.5 $38.1
$324.6 |
Employer Contributions
Employee Premium Payments
Total |
$30.4 $0.3
$30.7 |
| Total Expenses |
$88.0 |
Total
Expenses |
$233.4 |
Total
Expenses |
$22.8 |
| Balance | -55.8 | $91.2 | $7.9 | ||
| Towards Retirees' Imbalance* |
$49.6 |
$4.7 |
|||
| Towards Surplus | $41.6 | $3.2 | |||
| * Approximately $1.5 million of the retiree imbalance is covered by the Terminated Local fund. | |||||
Although the Board has authority to subsidize retiree costs, the statute requires that this be done in an equitable and financially responsible way. The Board needs to assess whether the level of subsidization for retirees is equitable and responsible. The choice of the Finance Board to take on the retiree costs has put significant pressure on the fiscal stability of the financial plans. From 1993 to 1999 State and Local employers have subsidized 60% to 70% of retirees' total medical insurance expenses. This necessity to rely on legislative assistance has caused an inequitable distribution of costs, with employers incurring most of the cost burden. The maintenance of the retiree costs has subsequently not been borne on retirees or active employees through premium increases.
Another factor is that the growth in the retiree imbalance between premium
payments and costs is increasing at a faster rate than the State's contribution.
Table 5 shows the growth rate in the retiree cost imbalance and state contributions
from 1993 to 2000. The retiree imbalance is growing twice as fast as the
amount the State provides for employees and retirees. This disparity in
growth rates will put pressure on the Legislature to either increase its
rate of funding for PEIA, or PEIA will have to find ways to reduce the
subsidy.
|
Growth Rate of Retiree Cost Imbalance & State Contributions |
||||
| Fiscal
Year |
Retiree Cost Imbalance | %
increase |
State
Contributions |
%
increase |
| 1993 | $34 million | $217.0 million | ||
| 2000 | $55.8 million | 64% | $286.5 million | 32% |
The Legislature may want to consider separating the employer's amounts
charged for employees and retirees. This would allow the Legislature to
have a better accounting of what is needed for each population (employees
and retirees) which have different health care needs, utilization, and
different growth rates in claim expenses. Retiree claim expenses are growing
nearly twice as fast as state employee claim expenses (see Table 6). This
would also help the planning process and provide greater equity distribution.
Currently, the way the system works, the Legislature provides a lump sum
for both employees and retirees based on what General Revenue growth allows.
The Finance Board must develop plans that make do with what the Legislature
provides. Given that retirees and employees have different claim expense
histories, the Board must ensure that what is available for both populations
is sufficient. If retiree expenses are growing disproportionately higher
than employees this requires an accommodation for retirees by adjusting
rates that affect employees.
| Table 6
Growth Rates in Total Claim Expenses for State Employees and Retirees |
||||
| Fiscal
Year |
Retirees |
%
Increase |
State Employees | %
Increase |
| 1993 | $52.8 Million | $156.7 Million | ||
| 2000 | $85.8 Million | 62.5% | $217.5 Million | 38.8% |
Cause #5: Utilization of PEIA Insurance may be High
Much discussion is given to rising medical and drug costs. However,
an equally important component of the total cost for PEIA insurance is
the rate at which the insurance is used, or the utilization rate. There
is evidence that utilization of PEIA insurance is high. A report provided
to the Board for 1999 showed that each enrollee with PEIA insurance averaged
one drug prescription per month, and retiree enrollees averaged 2.4 drug
scripts per month. These statistics initiated discussion concerning whether
the drug utilization rates were high compared to other programs. The actuary
indicated that a possible explanation is in the State's demographic circumstances,
for example the older West Virginia population.
In addition, PEIA initiated a comparison of West Virginia's utilization
of office visits, and emergency room utilization with three peer states
(Alabama, South Carolina, Texas), and similar private sector indemnity
plans. Table 7 shows that for these two categories, West Virginia's utilization
rate was significantly higher than comparison states. A possible explanation
for the high utilization could be West Virginia's high rural population.
However, when the emergency room utilization is shown for the State's 55
counties, several of the State's urban counties are over 200 visits per
1,000 enrollees. For example, Monogalia county had utilization
of 273; Wood 255;
Harrison 238; Cabell
219; and Kanawha 198. The Legislative Auditor attempted to
find comparable statistics for other components of health insurance from
other programs, but was unsuccessful.
|
Visits Per 1,000 Enrollees |
|||
| Emergency Room Utilization | 1996 | 1997 | 1998 |
| PEIA Indemnity Plan | 273 | 308 | 267 |
| Peer States | 163 | 158 | 159 |
| Other Similar Indemnity Plans | 169 | 170 | 169 |
| Office Visit Utilization | 1996 | 1997 | 1998 |
| PEIA Indemnity Plan | 3,678 | 3,507 | 4,267 |
| Peer States | 3,051 | 3,110 | 3,161 |
| Other Similar Indemnity Plans | 2,913 | 3,004 | 3,016 |
It was not until around 1998 that the Board began to address utilization through increasing co-payments, deductibles, out-of-pocket maximums, and developing a formulary drug plan in which drugs that are used that are not on the formulary list would cost more. This is indicated under cause number three. However, addressing utilization became necessary in part because the Board had to find ways to eliminate a financial deficit. For several years prior to 1998, the Board did not raise deductibles, co-payments, or out-of-pocket maximums. It is a logical conclusion that with most of the insurance costs being borne by employers, employees have little incentive to reduce their utilization of their insurance. The Board should continue to evaluate the utilization rate to determine if it remains too high for medical or drug use, and if so examine ways to reduce the utilization rate.
Conclusion
Although the Finance Board eliminated the large deficit that existed
in 1990, which it was created to do, the Board allowed a similar situation
to occur in 1997 and in 1998. The magnitude of the deficits in these two
years was not as large as in 1990; however, the intent of the Board is
to provide financial stability. To allow financial deficits, which the
Board was created to avoid, does not fit the definition of financial stability.
A primary cause is the Board's reluctance to raise premiums on employees
and retirees. The Board also does not operate with established objectives
that would encourage financial stability. Furthermore, the Board needs
to assess the utilization rate, and whether the retiree subsidization at
its current level is financially responsible.
Recommendation 1:
The Finance Board should establish written objectives to guide the
process of providing financial plans that promote financial stability.
These objectives should determine whether or not all plans should be balanced
for current operations, to what extent surpluses should be used and what
minimum level should be maintained at all times, what is an appropriate
percentage of costs that employees should pay, and what is a financially
responsible rate of subsidization for retirees.
Recommendation 2:
The Finance Board should continue to monitor the utilization rate
of its insurance plans to determine if medical or drug utilization continues
to be excessive, and if so, evaluate ways to reduce excessive utilization.
Recommendation 3:
The Legislature should consider providing a lump sum appropriation
to cover the portion of retiree costs for health insurance.